Chart
The real-time chart component offers an in-depth view of stock price movements across various time intervals, including real-time updates. It supports multiple chart types, pre-market and post-market data and customizable features to enhance the analysis of market trends.

Description
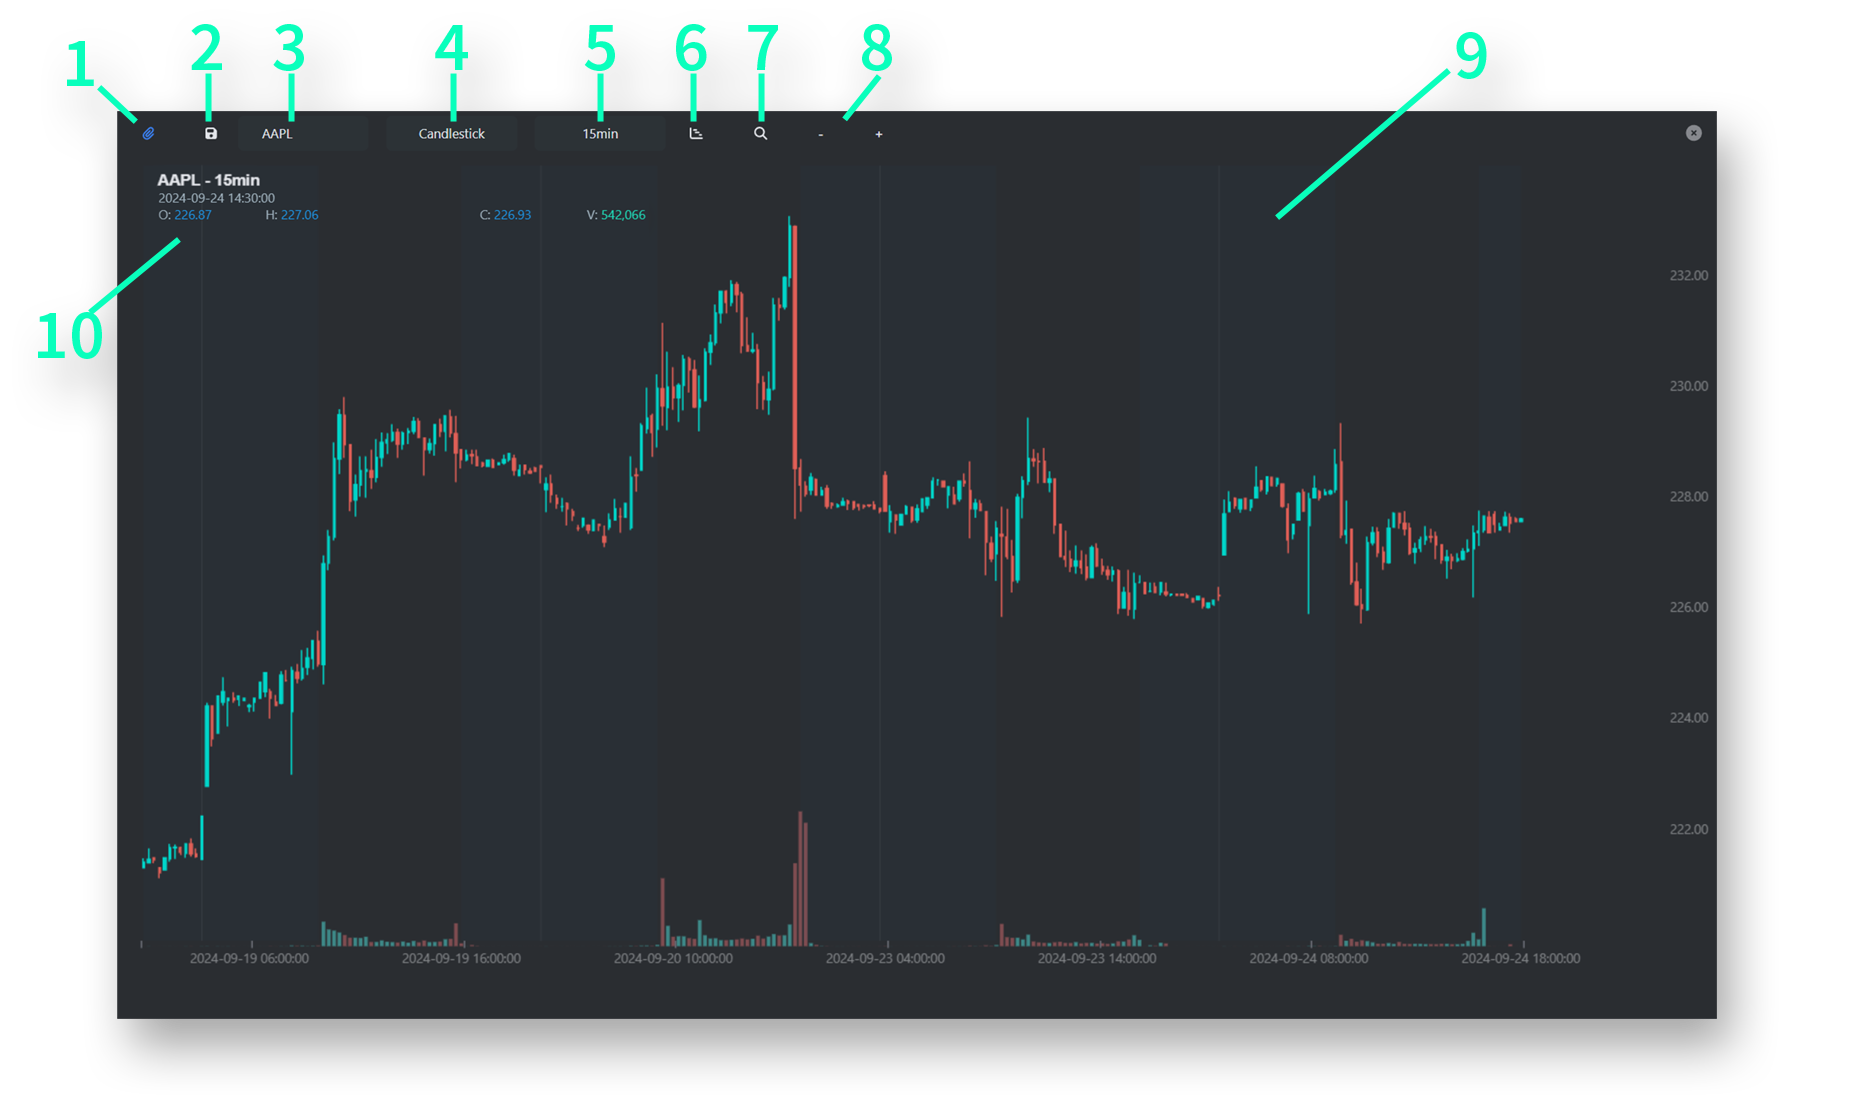
- Symbol Link Feature
- Save / Load / Default Preset: Save customized chart settings, load previous setups, or reset to default presets.
- Symbol Selection: Select a new symbol.
- Chart Selection: Choose between different chart types such as Line Chart, Candlestick, and Heiken Ashi.
- Interval Selection: Select the chart interval (e.g., 1 minute, 5 minutes, 15 minutes, 1 hour, 4 hours, 1 day, 1 week) to zoom into specific timeframes.
- Indicators Window: Opens the indicators panel to add technical indicators like moving averages, RSI, MACD, and more.
- Slider Zoom Toggle: Enables or disables the slider for zooming in or out on the chart.
- Sub-chart Space Adjustment: Use the + and - buttons to increase or decrease the space for sub-chart indicators such as volume or other technical indicators.
- Premarket and Aftermarket Regions (blue region): Highlights the premarket (4 PM to 9:30 AM) and aftermarket trading periods for better time-specific analysis.
- Legend: Displays the symbol name, timeframe, open, high, low, close prices, and volume for quick reference.
Usage
The Chart component allows for versatile and detailed stock analysis. You can switch between different chart types and time intervals, making it suitable for short-term traders as well as long-term investors. Customize the view by adding technical indicators and adjusting the sub-chart spaces for an optimal view of volume and other technical studies.
Remember to save your preferred indicators setup using the Presets feature.
This component keeps you updated on the latest price movements in real-time and serves as a strong foundation for your technical analysis.