Heatmap
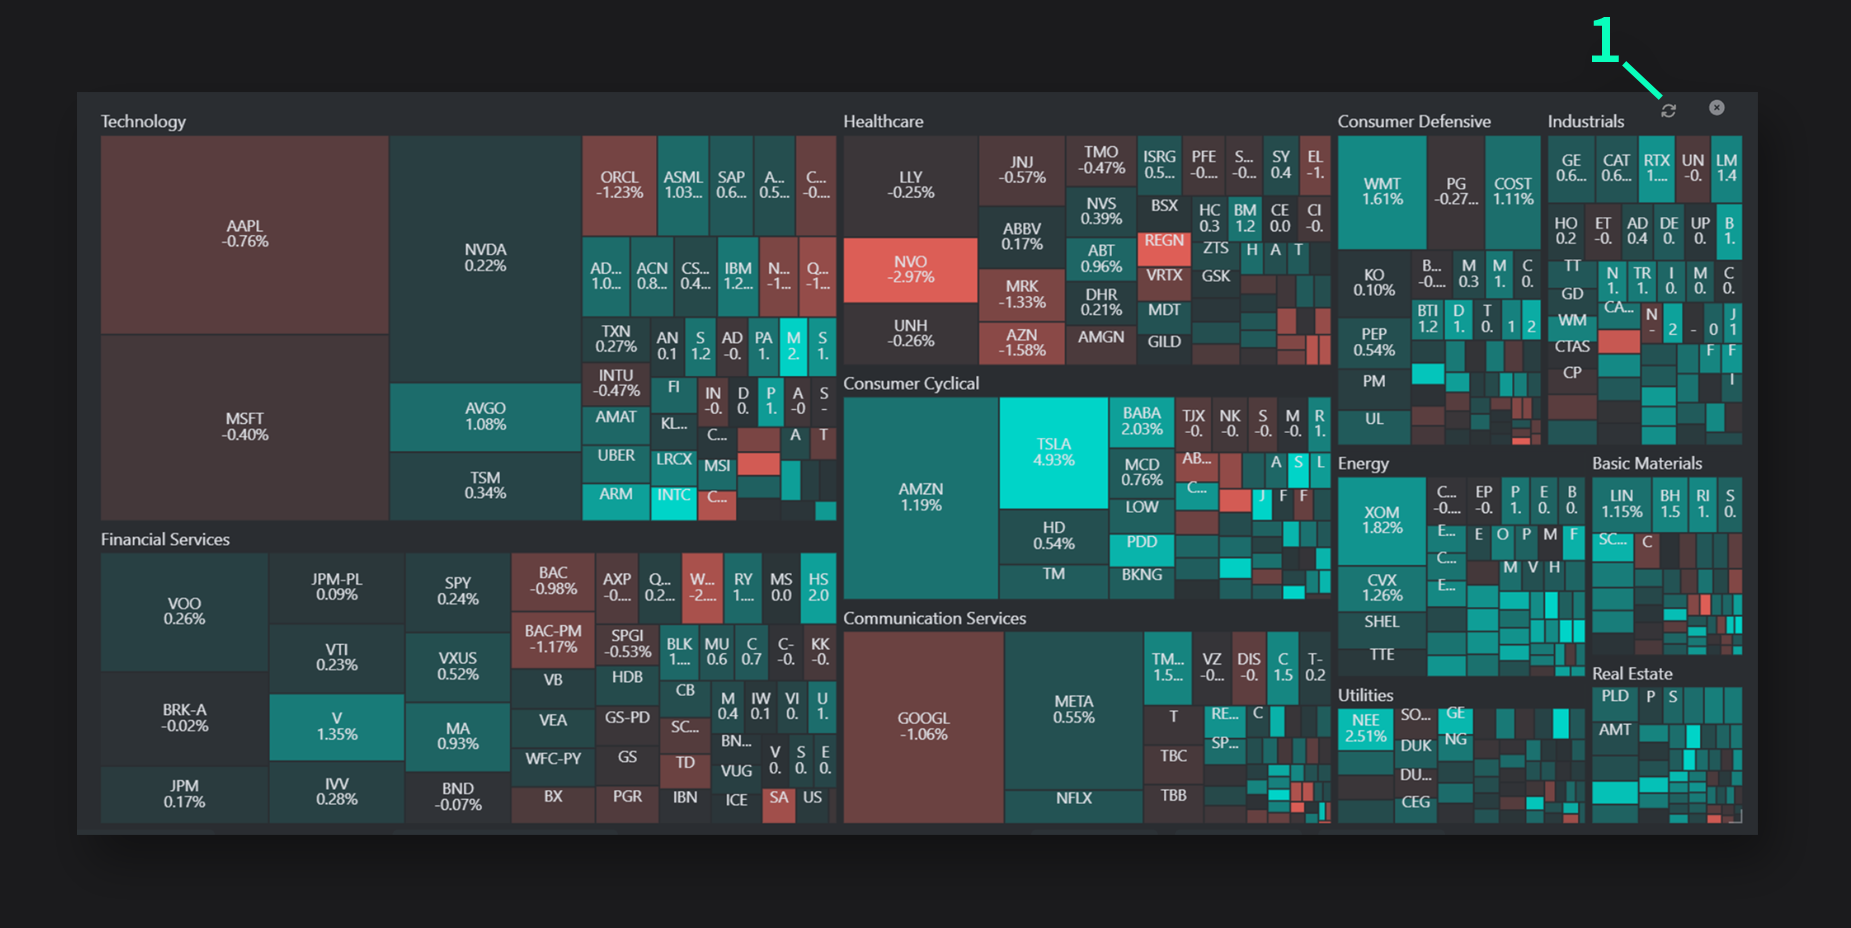
The Heatmap component offers a comprehensive visual representation of stock market performance, allowing you to quickly observe the movement of sectors and individual stocks. By analyzing the color intensity and size of the blocks, users can identify which sectors and companies are leading or lagging in the market.

Description
- Reset Zoom: Allows you to reset the zoom level, bringing the heatmap back to its default view. You can zoom in and out to examine specific sectors, symbols, or areas of interest.
Usage
The Heatmap component is a powerful tool for quickly assessing market trends and individual stock performances. By hovering over specific blocks, you can see detailed information about a stock's performance. You can also zoom in to explore particular sectors more closely. The size of each block represents the relative market capitalization, while the color indicates price movement: bullish color (green) for positive and bearish color (red) for negative changes. To fully utilize the Heatmap, zoom into sectors that matter most to your observation, to track trends based on color shifts.